Grundlæggende statistik
| Institutionelle ejere | 302 total, 287 long only, 3 short only, 12 long/short - change of 16,22% MRQ |
| Gennemsnitlig porteføljeallokering | 0.4164 % - change of 0,55% MRQ |
| Institutionelle aktier (lange) | 145.681.708 (ex 13D/G) - change of -30,16MM shares -25,08% MRQ |
| Institutionel værdi (lang) | $ 1.820.809 USD ($1000) |
Institutionelt ejerskab og aktionærer
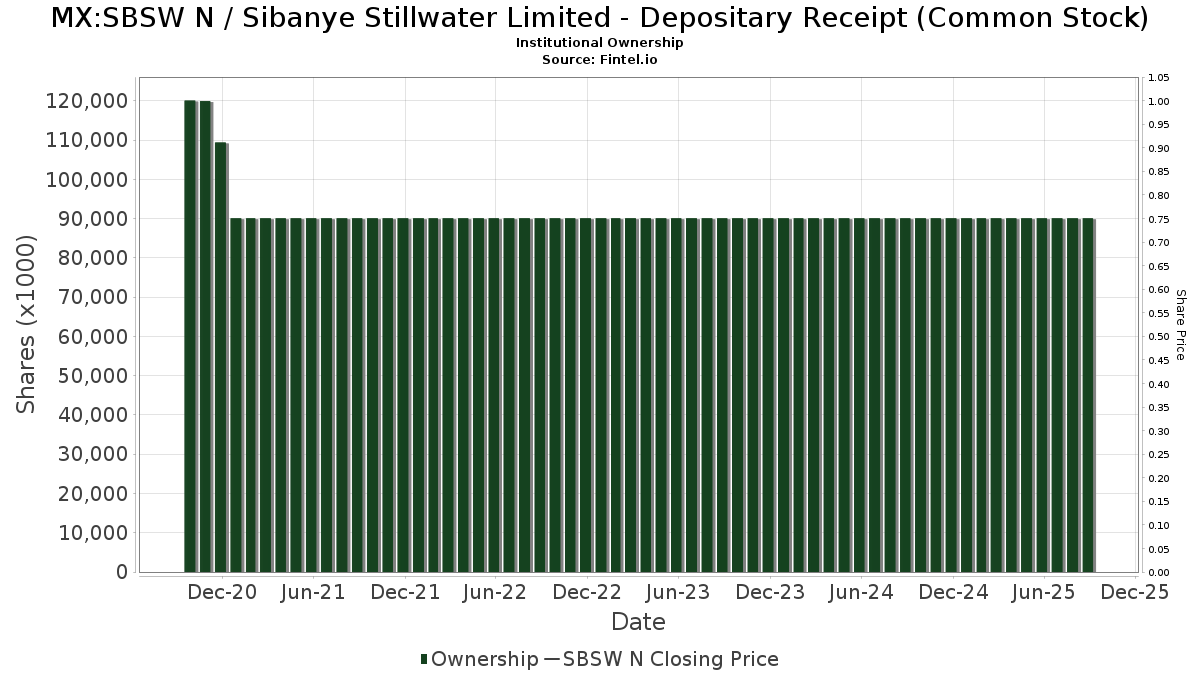
Sibanye Stillwater Limited - Depositary Receipt (Common Stock) (MX:SBSW N) har 302 institutionelle ejere og aktionærer, der har indsendt 13D/G- eller 13F-formularer til Securities Exchange Commission (SEC). Disse institutioner har i alt 147,392,791 aktier. Største aktionærer omfatter Exor Capital LLP, Arrowstreet Capital, Limited Partnership, Morgan Stanley, QCSTRX - Stock Account Class R1, Condire Management, LP, Acadian Asset Management Llc, Price T Rowe Associates Inc /md/, D. E. Shaw & Co., Inc., Goehring & Rozencwajg Associates, LLC, and Deutsche Bank Ag\ .
Sibanye Stillwater Limited - Depositary Receipt (Common Stock) (BMV:SBSW N) institutionel ejerskabsstruktur viser aktuelle positioner i virksomheden efter institutioner og fonde, samt seneste ændringer i positionsstørrelse. Større aktionærer kan omfatte individuelle investorer, investeringsforeninger, hedgefonde eller institutioner. Skema 13D angiver, at investoren besidder (eller besidder) mere end 5 % af virksomheden og har til hensigt (eller har til hensigt at) aktivt at forfølge en ændring i forretningsstrategi. Skema 13G indikerer en passiv investering på over 5%.
Fondens stemningsscore
Fund Sentiment Score (fka Ownership Accumulation Score) finder de aktier, der bliver mest købt af fonde. Det er resultatet af en sofistikeret, multi-faktor kvantitativ model, der identificerer virksomheder med de højeste niveauer af institutionel akkumulering. Scoringsmodellen bruger en kombination af den samlede stigning i oplyste ejere, ændringerne i porteføljeallokeringer i disse ejere og andre målinger. Tallet går fra 0 til 100, hvor højere tal indikerer et højere niveau af akkumulering for sine jævnaldrende, og 50 er gennemsnittet.
Opdateringsfrekvens: Dagligt
Se Ownership Explorer, som giver en liste over højest rangerende virksomheder.
AI+ Ask Fintel’s AI assistant about Sibanye Stillwater Limited - Depositary Receipt (Common Stock).
Select a question to share a public post with an AI-crafted answer.
Thinking of good questions…
13F og NPORT arkivering
Detaljer om 13F-arkivering er gratis. Detaljer om NP-ansøgninger kræver et premium-medlemskab. Grønne rækker angiver nye positioner. Røde rækker angiver lukkede positioner. Klik på linket ikon for at se den fulde transaktionshistorik.
Opgrader
for at låse premium-data op og eksportere til Excel ![]() .
.
| Fil dato | Kilde | Investor | Type | Gennemsnitlig pris (Øst) |
Aktier | Δ Aktier (%) |
Rapporteret Værdi ($1000) |
Δ Værdi (%) |
Port Alloc (%) |
|
|---|---|---|---|---|---|---|---|---|---|---|
| 2026-02-17 | 13F | Two Sigma Securities, Llc | 11.015 | -39,38 | 157 | -23,53 | ||||
| 2026-01-29 | 13F | Pictet Asset Management Holding SA | 438.083 | -50,00 | 6.243 | -36,62 | ||||
| 2026-02-17 | 13F | Jones Financial Companies Lllp | 9.678 | -24,39 | 138 | -3,52 | ||||
| 2026-02-17 | 13F | Capital Fund Management S.a. | Put | 58.400 | 140,33 | 832 | 204,76 | |||
| 2026-02-17 | 13F | Capital Fund Management S.a. | Call | 214.300 | 68,74 | 3.054 | 113,95 | |||
| 2026-02-12 | 13F | Bank Of Montreal /can/ | 20.980 | -75,27 | 299 | -68,73 | ||||
| 2026-02-17 | 13F | Voloridge Investment Management, Llc | 1.377.911 | -64,45 | 19.635 | -54,93 | ||||
| 2026-02-17 | 13F | Fmr Llc | 36.048 | -6,88 | 514 | 17,93 | ||||
| 2026-02-19 | 13F | Atomi Financial Group, Inc. | 23.866 | 17,49 | 340 | 49,12 | ||||
| 2025-09-25 | NP | DFEM - Dimensional Emerging Markets Core Equity 2 ETF | 150.978 | 0,00 | 1.262 | 79,77 | ||||
| 2026-02-06 | 13F | Global Retirement Partners, LLC | 337 | 44,64 | 5 | 100,00 | ||||
| 2026-02-11 | 13F | Erste Asset Management GmbH | 99.600 | 1.414 | ||||||
| 2026-02-17 | 13F | Millennium Management Llc | 1.665.426 | 13,62 | 23.732 | 44,05 | ||||
| 2026-02-13 | 13F | Y-Intercept (Hong Kong) Ltd | 89.023 | -42,71 | 1.269 | -27,38 | ||||
| 2026-02-17 | 13F | Millennium Management Llc | Call | 300.000 | 4.275 | |||||
| 2026-02-17 | 13F | Jump Financial, LLC | 231.114 | -48,24 | 3.293 | -34,38 | ||||
| 2026-02-13 | 13F | OMERS ADMINISTRATION Corp | 0 | -100,00 | 0 | |||||
| 2026-01-30 | 13F | Mitsubishi UFJ Trust & Banking Corp | 469.948 | 84,56 | 6.697 | 133,96 | ||||
| 2026-02-13 | 13F | Marshall Wace, Llp | 73.170 | 1.043 | ||||||
| 2026-01-26 | 13F | Private Trust Co Na | 100 | 1 | ||||||
| 2026-01-29 | 13F | UMA Financial Services, Inc. | 344 | -20,37 | 5 | 0,00 | ||||
| 2025-11-14 | 13F | AXA Investment Managers S.A. | 422.521 | 4.749 | ||||||
| 2026-02-17 | 13F | Dv Equities, Llc | 232 | 3 | ||||||
| 2026-02-13 | 13F | American Century Companies Inc | 2.566.468 | 11,86 | 36.572 | 41,82 | ||||
| 2025-11-14 | 13F | Financial Sense Advisors, Inc. | 0 | -100,00 | 0 | |||||
| 2026-01-07 | 13F | Hilltop National Bank | 2.102 | 0,00 | 30 | 26,09 | ||||
| 2026-02-13 | 13F | Blueshift Asset Management, LLC | 48.739 | 695 | ||||||
| 2026-01-29 | 13F | Beirne Wealth Consulting Services, LLC | 15.472 | 0,00 | 220 | 27,17 | ||||
| 2026-02-12 | 13F | Dimensional Fund Advisors Lp | 2.106.418 | 11,50 | 30.033 | 41,47 | ||||
| 2026-02-17 | 13F | Creative Planning | 243.808 | 62,72 | 3.474 | 106,29 | ||||
| 2026-01-26 | 13F | Moran Wealth Management, LLC | 162.020 | 10,33 | 2.309 | 39,88 | ||||
| 2026-02-17 | 13F | Man Group plc | 1.246.591 | 1.029,16 | 17.764 | 1.332,50 | ||||
| 2026-02-13 | 13F | Parkside Financial Bank & Trust | 91 | 0,00 | 1 | 0,00 | ||||
| 2026-02-17 | 13F | Oxford Asset Management Llp | 12.071 | 172 | ||||||
| 2026-02-17 | 13F | Northern Trust Corp | 1.080.227 | 0,92 | 15.393 | 27,94 | ||||
| 2026-02-06 | 13F/A | Rathbone Brothers plc | 13.936 | 0,00 | 199 | 26,92 | ||||
| 2026-02-13 | 13F | Toroso Investments, LLC | 16.340 | 233 | ||||||
| 2025-11-12 | 13F | Creative Financial Designs Inc /adv | 0 | -100,00 | 0 | |||||
| 2025-11-12 | 13F | Creekmur Asset Management LLC | 113 | -0,88 | 1 | |||||
| 2026-01-26 | 13F | Mirae Asset Global Investments Co., Ltd. | 15.524 | -60,14 | 221 | -49,43 | ||||
| 2025-11-18 | 13F | Dorsey Wright & Associates | 169.876 | 1.909 | ||||||
| 2026-02-17 | 13F | Tower Research Capital LLC (TRC) | 711 | 22,59 | 10 | 66,67 | ||||
| 2026-02-17 | 13F | Quantinno Capital Management LP | 52.627 | 113,56 | 750 | 171,38 | ||||
| 2026-01-07 | 13F | Qp Wealth Management, Llc | 64.688 | 922 | ||||||
| 2026-02-17 | 13F | Laird Norton Trust Company, Llc | 22.278 | 317 | ||||||
| 2026-02-09 | 13F | Hantz Financial Services, Inc. | 5.134 | 0 | ||||||
| 2026-02-19 | 13F | CI Private Wealth, LLC | 25.387 | 12,84 | 362 | 43,25 | ||||
| 2026-01-30 | 13F | Us Bancorp \de\ | 7.119 | 74,02 | 101 | 124,44 | ||||
| 2026-02-13 | 13F | Vontobel Holding Ltd. | 11.500 | 164 | ||||||
| 2025-08-28 | NP | GHTA - Goose Hollow Tactical Allocation ETF | 50.000 | 361 | ||||||
| 2026-01-20 | 13F | AdvisorNet Financial, Inc | 128 | 0,00 | 2 | 0,00 | ||||
| 2026-02-13 | 13F | Squarepoint Ops LLC | Call | 148.900 | -15,59 | 2.122 | 7,01 | |||
| 2026-02-13 | 13F | Squarepoint Ops LLC | Put | 210.100 | -32,47 | 2.994 | -14,39 | |||
| 2026-02-13 | 13F | Squarepoint Ops LLC | 37.099 | 529 | ||||||
| 2025-11-21 | 13F | Bell Investment Advisors, Inc | 107 | 1 | ||||||
| 2026-02-18 | 13F | Vident Advisory, LLC | 20.789 | -90,95 | 296 | -88,53 | ||||
| 2026-01-23 | 13F | Stanley-Laman Group, Ltd. | 284.141 | -13,20 | 4.049 | 10,06 | ||||
| 2026-02-17 | 13F | MIRAE ASSET GLOBAL ETFS HOLDINGS Ltd. | 11.284 | 50,05 | 165 | 95,24 | ||||
| 2026-01-08 | 13F | Fermata Advisors, LLC | 11.609 | -13,86 | 165 | 9,27 | ||||
| 2026-02-06 | 13F | Cadence Wealth Management LLC | 101.142 | 0,21 | 1.441 | 27,07 | ||||
| 2026-02-17 | 13F | Aquatic Capital Management LLC | 292.256 | -72,44 | 4.165 | -65,07 | ||||
| 2026-01-20 | 13F | Stratos Wealth Partners, LTD. | 15.982 | -9,69 | 228 | 14,65 | ||||
| 2025-11-05 | 13F | Anthracite Investment Company, Inc. | 0 | -100,00 | 0 | |||||
| 2025-11-12 | 13F | HAP Trading, LLC | Put | 100.000 | 3 | |||||
| 2025-09-29 | NP | CVSIX - Calamos Market Neutral Income Fund Class A | Short | -1.690.000 | -14.128 | |||||
| 2026-02-02 | 13F | Strs Ohio | 63.881 | -14,71 | 910 | 8,20 | ||||
| 2026-02-13 | 13F | Arrowstreet Capital, Limited Partnership | 7.315.944 | 81,31 | 104.252 | 129,87 | ||||
| 2026-02-13 | 13F/A | Virtus ETF Advisers LLC | 0 | -100,00 | 0 | |||||
| 2026-02-13 | 13F | Lord, Abbett & Co. Llc | 2.335.343 | 33 | ||||||
| 2026-01-21 | 13F | Sowell Financial Services LLC | 19.128 | -4,13 | 273 | 21,43 | ||||
| 2026-01-06 | 13F | Sanctuary Advisors, LLC | 0 | -100,00 | 0 | |||||
| 2026-02-13 | 13F | First Trust Advisors Lp | 16.120 | 230 | ||||||
| 2026-02-12 | 13F | Renaissance Technologies Llc | 0 | -100,00 | 0 | |||||
| 2026-02-17 | 13F | FIL Ltd | 111.500 | 1.589 | ||||||
| 2026-02-17 | 13F | United Capital Financial Advisers, Llc | 38.558 | -12,52 | 549 | 10,91 | ||||
| 2026-02-17 | 13F | Quadrature Capital Ltd | 75.272 | 1.073 | ||||||
| 2025-09-26 | NP | HAOSX - Harbor Overseas Fund Institutional Class | 7.738 | 65 | ||||||
| 2026-02-18 | 13F | Papamarkou Wellner Asset Management inc. | 57.719 | 0,00 | 822 | 26,85 | ||||
| 2026-02-10 | 13F | Savant Capital, LLC | 64.012 | 5,70 | 912 | 34,12 | ||||
| 2026-02-17 | 13F | XTX Topco Ltd | 128.534 | 1.832 | ||||||
| 2026-02-17 | 13F | GeoWealth Management, LLC | 0 | -100,00 | 0 | -100,00 | ||||
| 2026-01-22 | 13F | Comprehensive Money Management Services LLC | 35.451 | 0,42 | 505 | 27,53 | ||||
| 2026-02-17 | 13F | Perritt Capital Management Inc | 0 | -100,00 | 0 | -100,00 | ||||
| 2026-01-15 | 13F | Nisa Investment Advisors, Llc | 2.000 | 0,00 | 28 | 27,27 | ||||
| 2026-02-17 | 13F | Moore Capital Management, Lp | 319.165 | -47,15 | 4.548 | -33,00 | ||||
| 2025-11-14 | 13F | D. E. Shaw & Co., Inc. | Call | 0 | -100,00 | 0 | -100,00 | |||
| 2026-01-15 | 13F | Highline Wealth Partners Llc | 283 | 4 | ||||||
| 2026-02-12 | 13F | Sit Investment Associates Inc | 0 | -100,00 | 0 | |||||
| 2026-02-11 | 13F | O'shaughnessy Asset Management, Llc | 42.790 | 24,69 | 610 | 58,18 | ||||
| 2025-11-14 | 13F | Equitable Holdings, Inc. | 0 | -100,00 | 0 | |||||
| 2025-08-28 | NP | QCSTRX - Stock Account Class R1 | 6.148.625 | 44.393 | ||||||
| 2026-02-13 | 13F | Gts Securities Llc | 0 | -100,00 | 0 | |||||
| 2026-02-17 | 13F | Nokomis Capital, L.L.C. | 150.100 | 0,00 | 2.139 | 26,73 | ||||
| 2025-11-06 | 13F | Claudia M.p. Batlle, Crp (r) Llc | 0 | -100,00 | 0 | -100,00 | ||||
| 2026-02-17 | 13F | Balyasny Asset Management Llc | 519.554 | -45,44 | 7.404 | -30,83 | ||||
| 2025-11-14 | 13F | Cubist Systematic Strategies, LLC | Call | 91.700 | 1.031 | |||||
| 2026-02-11 | 13F | Group One Trading, L.p. | 20.478 | -96,20 | 292 | -95,19 | ||||
| 2025-11-14 | 13F | Cubist Systematic Strategies, LLC | 2.694.240 | 42,38 | 30.283 | 121,66 | ||||
| 2026-02-09 | 13F | GeoSphere Capital Management | 200.000 | 2.850 | ||||||
| 2025-09-25 | NP | Dfa Investment Trust Co - The Emerging Markets Series This fund is a listed as child fund of Dimensional Fund Advisors Lp and if that institution has disclosed ownership in this security, then these positions will not be double counted when calculating total shares and total value | 128.298 | 599,06 | 1.073 | 1.161,18 | ||||
| 2026-01-21 | 13F | Petra Financial Advisors Inc | 53.841 | -4,61 | 767 | 20,98 | ||||
| 2026-01-21 | 13F | TSP Capital Management Group, LLC | 22.351 | 9,29 | ||||||
| 2026-02-17 | 13F | D. E. Shaw & Co., Inc. | 3.556.894 | -42,41 | 50.686 | -26,98 | ||||
| 2026-02-17 | 13F | Slate Path Capital LP | 0 | -100,00 | 0 | |||||
| 2026-02-10 | 13F | Exor Capital LLP | 28.430.409 | 0,00 | 405.133 | 26,78 | ||||
| 2026-02-17 | 13F | Ancora Advisors, LLC | 37.000 | 527 | ||||||
| 2026-02-05 | 13F | Cambridge Investment Research Advisors, Inc. | 39.108 | -39,18 | 1 | |||||
| 2025-08-27 | NP | RYDEX VARIABLE TRUST - Precious Metals Fund Variable Annuity | 65.885 | -20,79 | 476 | 25,00 | ||||
| 2026-02-10 | 13F | State of Wyoming | 3.608 | 3,35 | 51 | 30,77 | ||||
| 2026-02-17 | 13F | Qube Research & Technologies Ltd | 123.147 | 1.755 | ||||||
| 2026-01-06 | 13F | Arlington Capital Management, Inc. | 275.386 | 3.924 | ||||||
| 2026-02-03 | 13F | Ballentine Partners, LLC | 11.247 | 160 | ||||||
| 2025-11-10 | 13F | O'Brien Greene & Co. Inc | 0 | -100,00 | 0 | -100,00 | ||||
| 2026-02-11 | 13F | Jpmorgan Chase & Co | 2.619.377 | -72,26 | 37.326 | -64,83 | ||||
| 2026-02-17 | 13F | SummitTX Capital, L.P. | 434.219 | 37,30 | 6.188 | 74,09 | ||||
| 2026-02-12 | 13F | Steward Partners Investment Advisory, Llc | 18.959 | 18,34 | 270 | 50,00 | ||||
| 2025-11-14 | 13F | Flow Traders U.s. Llc | 0 | -100,00 | 0 | |||||
| 2026-02-17 | 13F | Delaware Management Holdings, Inc. | 61.405 | 875 | ||||||
| 2026-01-23 | 13F | Financial Connections Group, Inc. | 500 | 0,00 | 0 | |||||
| 2026-02-06 | 13F | Pnc Financial Services Group, Inc. | 8.985 | 172,44 | 128 | 245,95 | ||||
| 2026-02-13 | 13F | BNP Paribas Asset Management Holding S.A. | 422.521 | 6 | ||||||
| 2026-02-09 | 13F | Employees Retirement System of Texas | 68.550 | 200,90 | 1 | |||||
| 2025-11-14 | 13F | Wetherby Asset Management Inc | 11.019 | 5,65 | 124 | 64,00 | ||||
| 2026-02-11 | 13F | LPL Financial LLC | 466.002 | -16,79 | 6.641 | 5,50 | ||||
| 2026-02-13 | 13F | Aire Advisors, Llc | 0 | -100,00 | 0 | |||||
| 2026-02-17 | 13F | Linden Advisors Lp | 0 | -100,00 | 0 | |||||
| 2026-02-13 | 13F | Aigen Investment Management, Lp | 0 | -100,00 | 0 | |||||
| 2025-11-14 | 13F | Evelyn Partners Investment Management (Europe) Ltd | 0 | -100,00 | 0 | -100,00 | ||||
| 2026-01-30 | 13F | Oakworth Capital, Inc. | 200 | -20,00 | 3 | 0,00 | ||||
| 2025-11-03 | 13F | Acuitas Investments, LLC | 0 | -100,00 | 0 | |||||
| 2026-02-11 | 13F | Total Wealth Planning & Management, Inc. | 17.801 | -24,58 | 254 | 48,82 | ||||
| 2026-01-28 | 13F | U S Global Investors Inc | 275.000 | -49,48 | 3.919 | -35,96 | ||||
| 2025-08-27 | NP | RYPMX - Precious Metals Fund Investor Class | 287.549 | -12,92 | 2.076 | 37,30 | ||||
| 2026-01-30 | 13F | Pekin Hardy Strauss, Inc. | 35.000 | 12,90 | 499 | 43,10 | ||||
| 2026-02-17 | 13F | Voleon Capital Management Lp | 418.300 | -23,57 | 5.961 | -3,11 | ||||
| 2026-02-06 | 13F | IFP Advisors, Inc | 958 | 0,00 | 14 | 30,00 | ||||
| 2026-02-11 | 13F | Janney Montgomery Scott LLC | 26.262 | -9,84 | 0 | |||||
| 2026-02-12 | 13F | SWAN Capital LLC | 200 | 0,00 | 3 | 0,00 | ||||
| 2026-02-13 | 13F | Caitong International Asset Management Co., Ltd | 4.915 | 3.289,66 | 70 | 6.900,00 | ||||
| 2026-02-13 | 13F | Ieq Capital, Llc | 11.218 | -10,25 | 160 | 13,57 | ||||
| 2025-11-14 | 13F | Marex Group plc | 0 | -100,00 | 0 | -100,00 | ||||
| 2026-01-27 | 13F | Regions Financial Corp | 30.250 | -27,11 | 431 | -7,51 | ||||
| 2025-09-25 | NP | DAADX - Emerging Markets ex China Core Equity Portfolio Institutional Class | 97.440 | -10,43 | 815 | 61,19 | ||||
| 2026-01-07 | 13F | BCGM Wealth Management, LLC | 491.358 | -30,35 | 7.002 | -11,70 | ||||
| 2026-01-22 | 13F | Financial Consulate, Inc | 540 | 8,00 | 8 | 40,00 | ||||
| 2026-02-11 | 13F | MCF Advisors LLC | 63 | 0,00 | 1 | |||||
| 2026-02-12 | 13F | Rossby Financial, LCC | Call | 1.500 | 21 | |||||
| 2025-11-12 | 13F | Nuveen, LLC | 0 | -100,00 | 0 | |||||
| 2026-02-12 | 13F | Rossby Financial, LCC | 20 | 0,00 | 0 | |||||
| 2026-01-14 | 13F | Redhawk Wealth Advisors, Inc. | 11.545 | 165 | ||||||
| 2026-02-06 | 13F | HighTower Advisors, LLC | 15.749 | 17,89 | 224 | 49,33 | ||||
| 2026-01-29 | 13F | UBS Group AG | Call | 244.600 | 64,94 | 3.486 | 109,18 | |||
| 2026-01-29 | 13F | UBS Group AG | 3.090.720 | -35,91 | 44.043 | -18,75 | ||||
| 2025-09-26 | NP | PMPIX - Precious Metals Ultrasector Profund Investor Class | 53.637 | -6,64 | 448 | 67,79 | ||||
| 2026-02-10 | 13F | Essex Financial Services, Inc. | 61.034 | 0,00 | 870 | 26,68 | ||||
| 2025-10-22 | 13F | D.a. Davidson & Co. | 0 | -100,00 | 0 | |||||
| 2026-02-17 | 13F | Russell Investments Group, Ltd. | 157.072 | 113,03 | 2.287 | 176,09 | ||||
| 2026-01-20 | 13F | Thurston, Springer, Miller, Herd & Titak, Inc. | 2.027 | 29 | ||||||
| 2026-02-11 | 13F | Deutsche Bank Ag\ | 3.469.111 | 49.435 | ||||||
| 2026-02-13 | 13F | Wells Fargo & Company/mn | 317.802 | -58,74 | 4.529 | -47,70 | ||||
| 2025-09-25 | NP | Dimensional Emerging Markets Value Fund - Dimensional Emerging Markets Value Fund This fund is a listed as child fund of Dimensional Fund Advisors Lp and if that institution has disclosed ownership in this security, then these positions will not be double counted when calculating total shares and total value | 618.213 | -35,22 | 5.168 | 16,48 | ||||
| 2026-02-04 | 13F | BCJ Capital Management, LLC | 345.906 | -13,47 | 4.929 | 9,70 | ||||
| 2026-02-13 | 13F | Mariner, LLC | 150.115 | 46,55 | 2.140 | 85,84 | ||||
| 2026-01-16 | 13F | Vanguard Capital Wealth Advisors This fund is a listed as child fund of Vanguard Group Inc and if that institution has disclosed ownership in this security, then these positions will not be double counted when calculating total shares and total value | 0 | -100,00 | 0 | |||||
| 2026-02-04 | 13F | ABN AMRO Bank N.V. | 0 | -100,00 | 0 | -100,00 | ||||
| 2026-02-13 | 13F | Centiva Capital, LP | 46.033 | 656 | ||||||
| 2026-01-28 | 13F | DekaBank Deutsche Girozentrale | 80.000 | 0,00 | 0 | |||||
| 2026-02-11 | 13F | Simplex Trading, Llc | 242.803 | 122,88 | 3.460 | 345.800,00 | ||||
| 2025-09-25 | NP | DFAE - Dimensional Emerging Core Equity Market ETF | 26.099 | 21,82 | 218 | 120,20 | ||||
| 2026-01-12 | 13F | Abound Wealth Management | 10 | 0 | ||||||
| 2026-01-15 | 13F | Burns Matteson Capital Management, LLC | 29.010 | 9,52 | 413 | 39,06 | ||||
| 2026-01-29 | 13F | Ashton Thomas Private Wealth, LLC | 0 | -100,00 | 0 | |||||
| 2026-02-10 | 13F | Acadian Asset Management Llc | 4.826.515 | 202,50 | 69 | 300,00 | ||||
| 2026-02-13 | 13F | Barclays Plc | 12.712 | -92,49 | 181 | -90,48 | ||||
| 2026-01-14 | 13F | Jfs Wealth Advisors, Llc | 620 | 0,00 | 9 | 33,33 | ||||
| 2026-02-13 | 13F | Wexford Capital Lp | 188.000 | 2.679 | ||||||
| 2025-09-25 | NP | DFAX - Dimensional World ex U.S. Core Equity 2 ETF | 71.654 | 7,88 | 599 | 94,48 | ||||
| 2026-02-12 | 13F | Hollencrest Capital Management | Call | 0 | -100,00 | 0 | -100,00 | |||
| 2026-02-02 | 13F | Alliance Wealth Advisors, LLC /UT | 10.813 | -13,80 | 154 | 10,00 | ||||
| 2026-02-13 | 13F | Hatch Cove Capital, Llc | 1.075.500 | 15.326 | ||||||
| 2026-02-17 | 13F | Asset One Wealth Management LLC | 13.165 | 222 | ||||||
| 2026-01-14 | 13F | ORG Wealth Partners, LLC | 601 | 7,13 | 9 | 33,33 | ||||
| 2026-02-13 | 13F | Smartleaf Asset Management LLC | 1.085 | 16 | ||||||
| 2026-02-11 | 13F | X-Square Capital, LLC | 0 | -100,00 | 0 | |||||
| 2026-02-10 | 13F | Envestnet Asset Management Inc | 235.322 | 8,77 | 3.353 | 37,93 | ||||
| 2026-02-12 | 13F | Stelac Advisory Services LLC | 11.941 | 0,00 | 170 | 26,87 | ||||
| 2026-02-12 | 13F | DJE Kapital AG | 0 | -100,00 | 0 | |||||
| 2026-01-05 | 13F | GAMMA Investing LLC | 7.214 | 40,16 | 103 | 78,95 | ||||
| 2025-11-06 | 13F | Abich Financial Wealth Management LLC | 50 | 1 | ||||||
| 2026-02-17 | 13F | Raymond James Financial Inc | 298.010 | -17,22 | 4.247 | 4,94 | ||||
| 2026-02-12 | 13F | Groupe la Francaise | 0 | -100,00 | 0 | |||||
| 2026-02-09 | 13F | Integrity Alliance, Llc. | 26.098 | 372 | ||||||
| 2026-02-12 | 13F | CIBC Private Wealth Group, LLC | 1.439 | 227,79 | 21 | 400,00 | ||||
| 2025-08-20 | NP | QSPIX - AQR Style Premia Alternative Fund Class I | 0 | -100,00 | 0 | -100,00 | ||||
| 2026-02-03 | 13F | Ethic Inc. | 10.298 | 147 | ||||||
| 2025-09-23 | NP | IIGIX - Voya Multi-Manager International Equity Fund Class I | 8.117 | 68 | ||||||
| 2026-02-17 | 13F | Public Employees Retirement System Of Ohio | 488.462 | 758,03 | 6.961 | 989,20 | ||||
| 2026-02-02 | 13F | Oppenheimer & Co Inc | 0 | -100,00 | 0 | -100,00 | ||||
| 2026-02-11 | 13F | Allianz Asset Management GmbH | 884.300 | 12.601 | ||||||
| 2025-11-12 | 13F | Sprott Inc. | 0 | -100,00 | 0 | -100,00 | ||||
| 2026-01-23 | 13F | Farther Finance Advisors, LLC | 9.043 | -2,28 | 129 | 23,08 | ||||
| 2026-01-09 | 13F | Diversified Trust Co | 21.942 | 313 | ||||||
| 2026-02-11 | 13F | Cerity Partners LLC | 10.673 | 152 | ||||||
| 2026-02-13 | 13F | National Bank Of Canada /fi/ | 35.640 | 380,06 | 508 | 510,84 | ||||
| 2026-02-13 | 13F | Panagora Asset Management Inc | 1.527.790 | 50,72 | 21.771 | 91,09 | ||||
| 2026-02-17 | 13F | Hartree Partners, LP | 0 | -100,00 | 0 | |||||
| 2026-02-13 | 13F | Peak6 Llc | Call | 154.100 | -92,33 | 2.196 | -90,28 | |||
| 2026-02-13 | 13F | Peak6 Llc | Put | 5.400 | 77 | |||||
| 2026-02-17 | 13F | PharVision Advisers, LLC | 20.895 | 2,13 | 298 | 29,69 | ||||
| 2026-02-11 | 13F | SmartHarvest Portfolios, LLC | 15.907 | 227 | ||||||
| 2025-11-06 | 13F | CIBC World Markets Inc. | 0 | -100,00 | 0 | |||||
| 2026-02-13 | 13F | Pathstone Holdings, LLC | 199.054 | -0,87 | 2.837 | 25,71 | ||||
| 2026-02-17 | 13F | Caption Management, LLC | Call | 830.000 | -24,17 | 11.828 | -3,86 | |||
| 2026-01-29 | 13F | UBS Group AG | Put | 0 | -100,00 | 0 | -100,00 | |||
| 2026-01-09 | 13F | Assenagon Asset Management S.A. | 1.427.032 | -56,04 | 20.335 | -44,27 | ||||
| 2026-01-05 | 13F | Confluence Investment Management Llc | 49.766 | 709 | ||||||
| 2026-02-13 | 13F | Stifel Financial Corp | 339.705 | -6,88 | 4.841 | 18,05 | ||||
| 2026-01-16 | 13F | Linden Thomas Advisory Services, LLC | 25.438 | 4,17 | 362 | 32,12 | ||||
| 2026-02-13 | 13F | Morgan Stanley | 6.898.349 | -28,52 | 98.301 | -9,38 | ||||
| 2026-02-12 | 13F | BRYN MAWR TRUST Co | 500 | 0,00 | 7 | 40,00 | ||||
| 2026-02-03 | 13F | SBI Securities Co., Ltd. | 47.324 | -11,78 | 674 | 11,96 | ||||
| 2026-01-27 | 13F | Evergreen Capital Management Llc | 80.825 | -12,26 | 1.152 | 11,21 | ||||
| 2026-02-17 | 13F | Manatuck Hill Partners, LLC | 80.000 | -20,00 | 1.140 | 1,42 | ||||
| 2026-02-12 | 13F | Skopos Labs, Inc. | 20.881 | 297 | ||||||
| 2026-01-15 | 13F | Hara Capital LLC | 5.913 | 0,00 | 84 | 27,27 | ||||
| 2025-09-25 | NP | DFEV - Dimensional Emerging Markets Value ETF | 35.053 | 0,00 | 293 | 80,86 | ||||
| 2026-02-02 | 13F | Hussman Strategic Advisors, Inc. | 20.000 | 285 | ||||||
| 2025-11-13 | 13F | Baird Financial Group, Inc. | 0 | -100,00 | 0 | |||||
| 2026-02-12 | 13F | Raiffeisen Bank International AG | Call | 1.534 | 0,00 | 17 | 0,00 | |||
| 2026-02-13 | 13F | Pinnacle Wealth Planning Services, Inc. | 3.201 | 46 | ||||||
| 2026-02-17 | 13F | Mangrove Partners | 0 | -100,00 | 0 | |||||
| 2025-08-26 | NP | GOAU - U.S. Global GO GOLD and Precious Metal Miners ETF | 556.542 | -9,74 | 4.018 | 38,36 | ||||
| 2026-01-27 | 13F | TD Waterhouse Canada Inc. | 300 | 0,00 | 4 | 33,33 | ||||
| 2026-02-17 | 13F | SIH Partners, LLLP | 0 | -100,00 | 0 | |||||
| 2026-02-17 | 13F | Advisor Group Holdings, Inc. | 118.268 | 6,04 | 1.685 | 45,76 | ||||
| 2025-11-14 | 13F | Axa S.a. | 0 | -100,00 | 0 | |||||
| 2026-02-13 | 13F | Integrated Wealth Concepts LLC | 0 | -100,00 | 0 | |||||
| 2025-11-03 | 13F | Stonehage Fleming Financial Services Holdings Ltd | 0 | -100,00 | 0 | |||||
| 2026-02-03 | 13F | Privium Fund Management B.V. | 0 | -100,00 | 0 | -100,00 | ||||
| 2026-02-10 | 13F | Goldman Sachs Group Inc | 2.190.327 | -49,77 | 31.212 | -36,32 | ||||
| 2026-02-13 | 13F | Citigroup Inc | 1.401 | -95,27 | 20 | -94,29 | ||||
| 2026-02-13 | 13F | Citigroup Inc | Call | 341.800 | 9,62 | 4.871 | 38,98 | |||
| 2026-02-17 | 13F | Royal Bank Of Canada | 55.142 | 32,33 | 786 | 67,95 | ||||
| 2025-11-12 | 13F | Headlands Technologies LLC | 0 | -100,00 | 0 | |||||
| 2025-10-20 | 13F | Ascent Group, LLC | 0 | -100,00 | 0 | -100,00 | ||||
| 2025-11-12 | 13F | Commonwealth Of Pennsylvania Public School Empls Retrmt Sys | 0 | -100,00 | 0 | |||||
| 2026-01-23 | 13F | Diversify Advisory Services, LLC | 54.300 | 8,97 | 911 | 74,66 | ||||
| 2026-02-12 | 13F | New York State Common Retirement Fund | 132.817 | -59,35 | 1.893 | -48,47 | ||||
| 2025-11-07 | 13F | Sierra Ocean, Llc | 0 | -100,00 | 0 | |||||
| 2026-02-17 | 13F | Bank Of America Corp /de/ | 106.702 | -89,97 | 1.521 | -87,28 | ||||
| 2026-01-16 | 13F | FNY Investment Advisers, LLC | 65.990 | -84,62 | 1 | -100,00 | ||||
| 2025-11-14 | 13F | Larson Financial Group LLC | 0 | -100,00 | 0 | |||||
| 2026-02-06 | 13F | Leonteq Securities AG | 14.548 | 207 | ||||||
| 2026-02-17 | 13F | Prelude Capital Management, Llc | 27.944 | 3,34 | 399 | 31,35 | ||||
| 2026-01-21 | 13F | Steadtrust LLC | 62.000 | 0,00 | 884 | 26,87 | ||||
| 2026-02-11 | 13F | Parallel Advisors, LLC | 6.423 | 3,58 | 92 | 31,88 | ||||
| 2025-11-14 | 13F | Massar Capital Management, LP | 0 | -100,00 | 0 | -100,00 | ||||
| 2026-02-13 | 13F | Walleye Trading LLC | Put | 187.400 | 1,35 | 2.670 | 28,49 | |||
| 2026-02-13 | 13F | Atlas Capital Advisors Llc | 8.832 | 86,49 | 126 | 267,65 | ||||
| 2026-02-13 | 13F | Banco Santander, S.A. | 21.086 | -35,96 | 300 | -18,92 | ||||
| 2026-02-13 | 13F | Walleye Trading LLC | Call | 296.500 | -4,39 | 4.225 | 21,23 | |||
| 2026-02-17 | 13F | Condire Management, LP | 5.244.469 | 5,63 | 74.734 | 33,92 | ||||
| 2026-02-13 | 13F | Cornerstone Financial Management LLC | 90 | 1 | ||||||
| 2026-02-12 | 13F | Lansforsakringar Fondforvaltning AB (publ) | 81.995 | 1.168 | ||||||
| 2026-02-12 | 13F | BlackRock, Inc. | 3.040.219 | 41,26 | 43.323 | 79,09 | ||||
| 2026-02-17 | 13F | Wiley Bros.-aintree Capital, Llc | 15.399 | -3,56 | 219 | 20,99 | ||||
| 2025-11-13 | 13F | Cladis Investment Advisory, LLC | 0 | -100,00 | 0 | |||||
| 2026-02-05 | 13F | Atria Investments Llc | 43.149 | -4,24 | 615 | 21,34 | ||||
| 2026-02-14 | 13F | Rockefeller Capital Management L.P. | 2.000 | -33,33 | 28 | -15,15 | ||||
| 2025-08-21 | NP | AFK - VanEck Vectors Africa Index ETF | 36.784 | 18,18 | 266 | 86,62 | ||||
| 2026-02-13 | 13F | Van Eck Associates Corp | 141.048 | 4,91 | 2 | 100,00 | ||||
| 2026-01-28 | 13F | Geneos Wealth Management Inc. | 200 | 0,00 | 3 | 0,00 | ||||
| 2026-02-17 | 13F | Schonfeld Strategic Advisors LLC | 191.084 | -45,02 | 2.723 | -30,31 | ||||
| 2026-02-13 | 13F | Walleye Capital LLC | 6 | 0 | ||||||
| 2026-02-12 | 13F | Federation des caisses Desjardins du Quebec | 220.457 | 0,58 | 3.141 | 27,53 | ||||
| 2026-02-17 | 13F | Nomura Holdings Inc | 189.252 | -20,83 | 2.697 | 0,37 | ||||
| 2025-11-10 | 13F | Raiffeisen Bank International AG | 0 | -100,00 | 0 | -100,00 | ||||
| 2026-01-14 | 13F | ORG Partners LLC | 5.300 | 46,98 | 76 | 87,50 | ||||
| 2026-02-10 | 13F/A | Northwestern Mutual Wealth Management Co | 2.554 | -26,63 | 36 | -7,69 | ||||
| 2026-02-13 | 13F | Walleye Capital LLC | Call | 469.100 | 69,78 | 6.685 | 115,27 | |||
| 2026-02-13 | 13F | Walleye Capital LLC | Put | 370.800 | -11,19 | 5.284 | 12,60 | |||
| 2026-01-22 | 13F | Personal Cfo Solutions, Llc | 28.546 | 5,61 | 407 | 33,99 | ||||
| 2025-09-26 | NP | TEMRX - TIAA-CREF Emerging Markets Equity Fund Retail Class | 1.942.619 | -12,59 | 16.240 | 57,15 | ||||
| 2026-01-26 | 13F | Abbington Investment Group | 238.707 | 5,51 | 3.402 | 33,79 | ||||
| 2026-02-11 | 13F | Empowered Funds, LLC | 46.871 | 70,57 | 668 | 116,56 | ||||
| 2026-02-11 | 13F | Winton Capital Group Ltd | 11.200 | 160 | ||||||
| 2025-11-06 | 13F | CENTRAL TRUST Co | 0 | -100,00 | 0 | |||||
| 2026-02-17 | 13F | MAC Alpha Capital Management, LP | 778.407 | 11.092 | ||||||
| 2026-02-17 | 13F | Wellington Management Group Llp | 1.265.129 | -16,51 | 18.028 | 5,85 | ||||
| 2025-11-14 | 13F | Concentric Capital Strategies, LP | 0 | -100,00 | 0 | -100,00 | ||||
| 2026-02-13 | 13F | Altrafin AG | 0 | -100,00 | 0 | |||||
| 2026-02-10 | 13F/A | MJT & Associates Financial Advisory Group, Inc. | 350 | 0,00 | 5 | 33,33 | ||||
| 2026-02-13 | 13F | MAI Capital Management | 0 | -100,00 | 0 | |||||
| 2026-02-10 | 13F | Bnp Paribas Arbitrage, Sa | 2.255.549 | 28,71 | 32.142 | 63,19 | ||||
| 2026-02-17 | 13F | Citadel Advisors Llc | 283.628 | 928,83 | 4.042 | 1.207,77 | ||||
| 2026-02-17 | 13F | Citadel Advisors Llc | Call | 1.647.300 | 89,63 | 23.474 | 140,41 | |||
| 2026-02-17 | 13F | Citadel Advisors Llc | Put | 922.700 | 20,27 | 13.148 | 52,48 | |||
| 2026-02-17 | 13F | Private Advisor Group, LLC | Call | 0 | -100,00 | 0 | ||||
| 2025-09-17 | NP | NWXSX - Nationwide International Small Cap Fund Class A | 63.960 | 535 | ||||||
| 2026-02-12 | 13F | EntryPoint Capital, LLC | 0 | -100,00 | 0 | |||||
| 2025-09-25 | NP | DFCEX - Emerging Markets Core Equity Portfolio - Institutional Class This fund is a listed as child fund of Dimensional Fund Advisors Lp and if that institution has disclosed ownership in this security, then these positions will not be double counted when calculating total shares and total value | 851.118 | -10,22 | 7.115 | 61,41 | ||||
| 2026-02-10 | 13F | Connor, Clark & Lunn Investment Management Ltd. | 1.846.682 | 503,84 | 26.315 | 665,64 | ||||
| 2026-02-12 | 13F | Hohimer Wealth Management, Llc | 0 | -100,00 | 0 | |||||
| 2026-01-30 | 13F | Sigma Planning Corp | 24.774 | -27,51 | 353 | -8,07 | ||||
| 2026-02-13 | 13F | Sei Investments Co | 518.348 | 125,53 | 7.386 | 185,95 | ||||
| 2026-02-17 | 13F | Capital Fund Management S.a. | 107.464 | 1.531 | ||||||
| 2026-02-17 | 13F | Cetera Investment Advisers | 254.378 | -9,91 | 3.625 | 14,21 | ||||
| 2026-02-17 | 13F | Old Mission Capital Llc | 80.984 | 1.154 | ||||||
| 2026-01-26 | 13F | Cwm, Llc | 30.126 | 2.961,59 | 0 | |||||
| 2026-02-05 | 13F | Allworth Financial LP | 2.368 | 10,65 | 34 | 37,50 | ||||
| 2026-02-06 | 13F | Resolute Wealth Strategies, LLC | 11.200 | 0,00 | 160 | 27,20 | ||||
| 2026-02-04 | 13F | Abc Arbitrage Sa | 1.749.026 | -56,63 | 24.924 | -45,02 | ||||
| 2026-01-16 | 13F | Ronald Blue Trust, Inc. | 2.193 | 84,13 | 31 | 138,46 | ||||
| 2025-11-14 | 13F | ExodusPoint Capital Management, LP | 110.014 | -56,22 | 1.237 | 123.500,00 | ||||
| 2026-02-17 | 13F | Trexquant Investment LP | 145.394 | -75,30 | 2.072 | -68,70 | ||||
| 2025-08-21 | NP | GMET - VanEck Green Metals ETF | 42.953 | 4,57 | 310 | 64,89 | ||||
| 2026-01-23 | 13F | Westside Investment Management, Inc. | 2.080 | 0,00 | 30 | 30,43 | ||||
| 2026-01-23 | 13F | Avion Wealth | 500 | 0,00 | 0 | |||||
| 2025-08-27 | NP | TIFF INVESTMENT PROGRAM - TIFF Multi-Asset Fund | Short | -21.083 | -44,32 | -152 | -12,14 | |||
| 2026-02-13 | 13F | Bridgewater Associates, LP | 265.680 | -60,64 | 3.786 | -50,11 | ||||
| 2025-10-20 | 13F | Shilanski & Associates, Inc. | 27.905 | 314 | ||||||
| 2026-02-13 | 13F | Dynamic Technology Lab Private Ltd | 0 | -100,00 | 0 | |||||
| 2026-01-27 | 13F | Bayforest Capital Ltd | 0 | -100,00 | 0 | |||||
| 2026-02-13 | 13F | JustInvest LLC | 49.935 | 3,42 | 712 | 31,18 | ||||
| 2026-01-21 | 13F | Stone House Investment Management, LLC | 13 | 0 | ||||||
| 2025-11-14 | 13F | Virtu Financial LLC | 0 | -100,00 | 0 | |||||
| 2026-02-17 | 13F | Engineers Gate Manager LP | 118.737 | 59,27 | 1.692 | 102,15 | ||||
| 2026-01-09 | 13F | SG Americas Securities, LLC | 18.424 | -9,31 | 0 | |||||
| 2026-02-10 | 13F | Moors & Cabot, Inc. | 14.250 | 4,78 | 203 | 33,55 | ||||
| 2026-02-13 | 13F | PCM Encore, LLC | 36.219 | 516 | ||||||
| 2026-02-17 | 13F | Guggenheim Capital Llc | 57.559 | -26,91 | 820 | -7,34 | ||||
| 2026-01-23 | 13F | Bingham Private Wealth, Llc | 11.841 | 169 | ||||||
| 2025-09-23 | NP | MYINX - MainStay MacKay International Opportunities Fund Investor Class | 27.427 | 229 | ||||||
| 2026-02-17 | 13F | Point72 Asset Management, L.P. | Call | 81.900 | 1.167 | |||||
| 2026-02-17 | 13F | Point72 Asset Management, L.P. | 1.814.607 | 777,05 | 25.858 | 1.012,17 | ||||
| 2026-02-17 | 13F | Point72 Asset Management, L.P. | Put | 14.400 | 205 | |||||
| 2026-02-17 | 13F | Aqr Capital Management Llc | 145.420 | 2.072 | ||||||
| 2025-11-14 | 13F | Lazard Asset Management Llc | 0 | -100,00 | 0 | |||||
| 2026-02-13 | 13F | Eschler Asset Management LLP | 235.475 | 229,03 | 3.356 | 317,29 | ||||
| 2026-02-10 | 13F | Quantbot Technologies LP | 149.463 | 6,15 | 2.130 | 34,58 | ||||
| 2026-02-17 | 13F | Kelly Lawrence W & Associates Inc/ca | 0 | -100,00 | 0 | |||||
| 2026-02-17 | 13F | Private Advisor Group, LLC | 22.302 | -41,77 | 318 | -26,28 | ||||
| 2026-02-02 | 13F | Truist Financial Corp | 17.390 | -4,50 | 248 | 21,08 | ||||
| 2025-11-14 | 13F | Wolverine Trading, Llc | 101.709 | 119,36 | 1.143 | 251,69 | ||||
| 2026-02-06 | 13F | Griffin Asset Management, Inc. | 16.725 | 0,30 | 238 | 27,27 | ||||
| 2026-02-17 | 13F | SwitchPoint Financial Planning, LLC | 10.880 | 0,00 | 155 | 27,05 | ||||
| 2025-11-14 | 13F | Wolverine Trading, Llc | Call | 339.100 | 47,82 | 3.811 | 137,00 | |||
| 2025-11-14 | 13F | Wolverine Trading, Llc | Put | 196.100 | 29,78 | 2.204 | 108,12 | |||
| 2026-02-18 | 13F | Mackenzie Financial Corp | 227.499 | 4,54 | 3.315 | 35,54 | ||||
| 2026-02-12 | 13F | Commonwealth Equity Services, Llc | 45.980 | -24,15 | 655 | |||||
| 2025-09-25 | NP | DFA INVESTMENT DIMENSIONS GROUP INC - World ex U.S. Targeted Value Portfolio Institutional Class This fund is a listed as child fund of Dimensional Fund Advisors Lp and if that institution has disclosed ownership in this security, then these positions will not be double counted when calculating total shares and total value | 33.192 | 0,00 | 277 | 79,87 | ||||
| 2025-11-12 | 13F | NewSquare Capital LLC | 0 | -100,00 | 0 | |||||
| 2026-02-17 | 13F | Price T Rowe Associates Inc /md/ | 4.422.648 | 63 | ||||||
| 2026-02-12 | 13F | Quadrant Capital Group Llc | 5.346 | 4,05 | 76 | 33,33 | ||||
| 2025-09-25 | NP | DFA INVESTMENT DIMENSIONS GROUP INC - World ex U.S. Core Equity Portfolio Institutional Class Shares | 9.956 | 0,00 | 83 | 80,43 | ||||
| 2026-02-05 | 13F | Elyxium Wealth, LLC | 237 | 3 | ||||||
| 2025-09-25 | NP | DEXC - Dimensional Emerging Markets ex China Core Equity ETF | 51.903 | 7,27 | 434 | 93,30 | ||||
| 2026-01-30 | 13F | Glenorchy Capital Ltd | Call | 100 | 0,00 | 1 | 0,00 | |||
| 2026-02-17 | 13F | Two Sigma Investments, Lp | 2.156.966 | -39,04 | 30.737 | -22,71 | ||||
| 2026-02-06 | 13F | EverSource Wealth Advisors, LLC | 10.591 | 6,60 | 151 | 35,14 | ||||
| 2026-02-17 | 13F | Two Sigma Investments, Lp | Put | 1.810.600 | 0,00 | 25.801 | 26,78 | |||
| 2025-11-13 | 13F | Jefferies Financial Group Inc. | Put | 0 | -100,00 | 0 | -100,00 | |||
| 2025-11-13 | 13F | Jefferies Financial Group Inc. | Call | 0 | -100,00 | 0 | -100,00 | |||
| 2026-02-11 | 13F | Mandatum Life Insurance Co Ltd | 71.282 | -27,67 | 1.016 | -8,31 | ||||
| 2026-02-13 | 13F | Pine Valley Investments Ltd Liability Co | 38.410 | 38,99 | 547 | 501,10 | ||||
| 2026-02-17 | 13F | Ionic Capital Management LLC | 0 | -100,00 | 0 | |||||
| 2026-01-20 | 13F | Signaturefd, Llc | 13.589 | 27,44 | 194 | 62,18 | ||||
| 2025-09-25 | NP | DFSE - Dimensional Emerging Markets Sustainability Core 1 ETF | 9.200 | 0,00 | 77 | 80,95 | ||||
| 2026-02-17 | 13F | Cantor Fitzgerald, L. P. | 0 | -100,00 | 0 | |||||
| 2026-02-09 | 13F | Jefferies Financial Group Inc. | 0 | -100,00 | 0 | -100,00 | ||||
| 2026-01-30 | 13F | Archer Investment Corp | 0 | -100,00 | 0 | -100,00 | ||||
| 2026-01-30 | 13F | Glenorchy Capital Ltd | 375.719 | -4,11 | 5.354 | 21,55 | ||||
| 2026-01-28 | 13F | Morton Brown Family Wealth, LLC | 35 | 0,00 | 0 | |||||
| 2025-10-14 | 13F | Yousif Capital Management, Llc | 0 | -100,00 | 0 | |||||
| 2026-01-30 | 13F | Kiker Wealth Management, LLC | 0 | -100,00 | 0 | |||||
| 2026-02-12 | 13F | Jane Street Group, Llc | Call | 368.600 | -7,80 | 5.253 | 16,89 | |||
| 2026-02-12 | 13F | Jane Street Group, Llc | 1.340.516 | 17,60 | 19.102 | 49,09 | ||||
| 2026-01-23 | 13F | Assetmark, Inc | 265 | 105,43 | 4 | 200,00 | ||||
| 2026-02-12 | 13F | Jane Street Group, Llc | Put | 345.100 | 210,90 | 4.918 | 294,31 | |||
| 2026-02-04 | 13F | Meridian Wealth Management, LLC | 12.490 | 0,16 | 178 | 26,43 | ||||
| 2026-02-17 | 13F | Two Sigma Advisers, Lp | 2.428.800 | -30,29 | 34.610 | -11,62 | ||||
| 2026-02-12 | 13F | Hrt Financial Lp | 92.333 | 14,07 | 1 | |||||
| 2026-02-17 | 13F | Ionic Capital Management LLC | Put | 0 | -100,00 | 0 | ||||
| 2026-02-18 | 13F | NFP Retirement, Inc. | 16.500 | 0,00 | 235 | 27,03 | ||||
| 2026-01-12 | 13F | Foster Group, Inc. | 176.647 | 39,48 | 2.517 | 76,88 | ||||
| 2026-02-17 | 13F | Tudor Investment Corp Et Al | 13.495 | 192 | ||||||
| 2026-02-17 | 13F | Tudor Investment Corp Et Al | Call | 79.500 | -6,69 | 1.133 | 18,29 | |||
| 2026-02-17 | 13F | Susquehanna International Group, Llp | Call | 2.348.200 | 33,79 | 33.462 | 69,61 | |||
| 2026-02-18 | 13F | GWM Advisors LLC | 5.000 | -82,01 | 71 | -77,24 | ||||
| 2026-01-29 | 13F | Rakuten Securities, Inc. | 935 | 13 | ||||||
| 2026-02-10 | 13F | AdvisorShares Investments LLC | 112.066 | -9,18 | 1.597 | 15,07 | ||||
| 2026-02-17 | 13F | Susquehanna International Group, Llp | 2.481.695 | -1,48 | 35.364 | 24,91 | ||||
| 2026-02-17 | 13F | Susquehanna International Group, Llp | Put | 1.372.000 | 13,93 | 19.551 | 44,45 | |||
| 2026-02-12 | 13F | Hollencrest Capital Management | 44 | 0,00 | 1 | |||||
| 2026-01-08 | 13F | True Wealth Design, LLC | 166 | -7,26 | 2 | 0,00 | ||||
| 2026-02-04 | 13F | Beverly Hills Private Wealth, LLC | 19.207 | 0,00 | 216 | 0,00 | ||||
| 2026-02-13 | 13F | Verition Fund Management LLC | Put | 25.200 | -64,85 | 359 | -55,40 | |||
| 2026-02-13 | 13F | Verition Fund Management LLC | 133.760 | 3,35 | 1.906 | 31,09 | ||||
| 2026-02-11 | 13F | Gordian Capital Singapore Pte Ltd | 162.000 | 15,71 | 2.308 | 46,73 | ||||
| 2026-02-03 | 13F | Diversify Wealth Management, Llc | 149.214 | 8,18 | 2.558 | 77,32 | ||||
| 2025-10-28 | 13F | BXM Wealth LLC | 0 | -100,00 | 0 | -100,00 | ||||
| 2025-09-26 | NP | AEMGX - Acadian Emerging Markets Portfolio Investor Class Shares | 85.683 | 716 | ||||||
| 2026-02-06 | 13F | Profund Advisors Llc | 89.356 | 2,36 | 1.273 | 29,77 | ||||
| 2026-02-13 | 13F | Goehring & Rozencwajg Associates, LLC | 3.539.680 | 5,35 | 50.440 | 33,56 | ||||
| 2025-12-03 | 13F | Strategic Investment Solutions, Inc. /IL | 0 | -100,00 | 0 | |||||
| 2026-02-17 | 13F | DZ BANK AG Deutsche Zentral Genossenschafts Bank, Frankfurt am Main | 0 | -100,00 | 0 | |||||
| 2026-01-08 | 13F | Wealth Enhancement Advisory Services, Llc | 0 | -100,00 | 0 | |||||
| 2026-02-13 | 13F | Hurley Capital, LLC | 436 | 6 | ||||||
| 2026-02-17 | 13F | Ameriprise Financial Inc | 18.734 | 9,58 | 267 | 38,54 |